Crash Lethality
In yesterday's post I tried to show that the
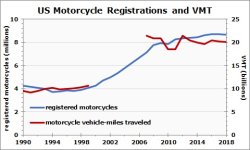
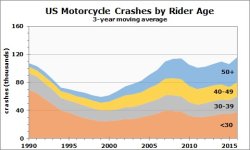
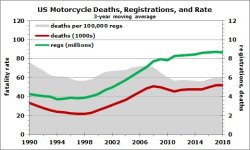
motorcycle fatality rate per registered bike increased as the sport grew quickly from the late 1990s until the recession hit in 2008. Maybe this was caused by a rising crash rate--more crashes, more deaths? No. A graph back in
post #6 showed that crash rate had not climbed that way. In fact, it declined in the early 1990s then flattened through the early 2000s. What gives?
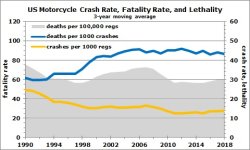
Another way to look at fatality rate is as a combination of crash rate and crash lethality--the percentage of motorcycles involved in crashes multiplied by the percentage of crashes that kill the motorcyclist. If 2% of registered motorcycles crashed over a year's time, and 3% of those crashes resulted in death, then 0.06% of motorcycles were involved in a fatal crash. Crash lethality helps explain the apparent contradiction between a falling crash rate and a rising fatality rate.
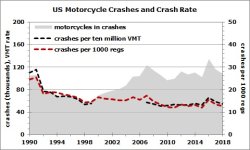
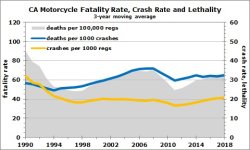
This graph shows three plots for the US since 1990. Fatality rate (gray shaded area) is the same as in yesterday's post. But instead of showing it along with registrations and deaths, I've combined it with crash rate (gold) and crash lethality (blue).
At first, crash rate and fatality rate declined in parallel as the motorcycle depression of the 1990s came to an end. A lot of factors surely contributed--the spread of training, more capable motorcycles, greater safety awareness among riders. Another factor I suspect is related directly to the decline of motorcycling. As the sport collapsed in the late 1980s, sales dropped by nearly two-thirds, so there were fewer new riders and proportionally more veterans on the road. Because of this, average motorcyclist experience was up, and we know from the Hurt and MAIDS crash studies that experience substantially reduces crash risk.
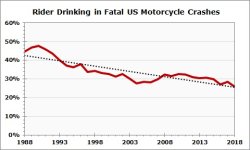
However, when the motorcycling resurgence began in the late 1990s, crash rate flattened out but the fatality rate reversed and began to climb. This was because motorcycle crashes were becoming more deadly. In the early 1990s, before the boom kicked off, the lethality rate was already climbing. From a low of 30 deaths per 1000 crashes in 1992, it rose by more than one-third in less than 10 years and continued to increase until the recession hit. By then, crash rate was near an all-time low, but, driven by crash lethality, the fatality rate was higher than it had been in more than 15 years.
When the boom came to an end in 2008, the fatality rate dropped by 25% in four years, drawn down by a similar decline in crash rate, and that is how it has remained through 2018. My hunch is that the recent crash rate drop was, again, the noob/vet effect--fewer new riders, more veterans, lower average risk. Unfortunately, our all-time low crash rate--20% less than post-depression low of 1999-2000--has not been accompanied by an all-time low fatality rate. High crash lethality has kept that achievement out of reach.
Tomorrow I will identify factors that have driven crash lethality to its current high level and will keep it there for the near future.
California and the Bay Area
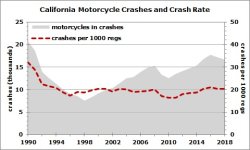
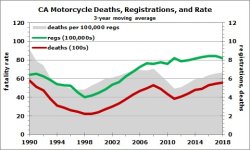
The California graph of fatality rate, crash rate, and crash lethality is similar to the US, so my previous analysis applies, at least generally. However, I do want to point out some differences.
My confidence in California crash counts for the 1990s isn't real high, so neither is my confidence in crash rate and lethality. However, I feel pretty good about crash counts from 2000 forward. I am much more confident about registrations and fatalities, so I trust fatality rate over the entire range.
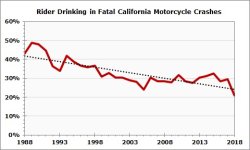
Notice that the California crash rate (gold line) is higher than the US--most likely due to our year-round riding--while lethality (blue line) is lower--probably due to the helmet law. Yet the fatality rate (gray shaded area) for both is in the neighborhood of 60 deaths per 100,000 registrations. End result is the same, but contributing factors differ.
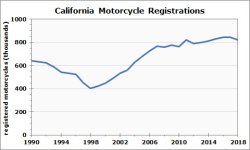
The precipitous drop in fatality rate from 1990 to 1994 is due to two big factors: First, the training requirement for riders < age 21 went into effect in 1991 (the < 18 requirement began in 1987). Whether training made them safer or dissuaded them from taking up the sport in the first place is more of a philosophical question at this point. Whatever. Young riders were a big demographic in the sport in 1990, so the training requirement very likely prevented crashes. Second, the all-rider helmet law went into effect January 1, 1992. Again the question is dissuasion or prevention, but it certainly saved lives.
Compared to the US, California's fatality rate dropped more sharply at the onset of the recession in 2008, and while the US rate has been flat since, California's increased, though not revisiting the pre-recession high. Notice that crash rate and crash lethality have both driven California's post-recession fatality rate higher since 2011.
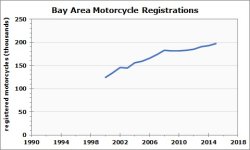
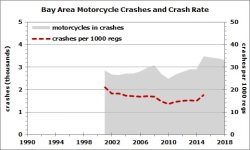
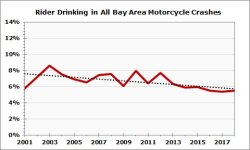
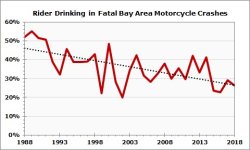
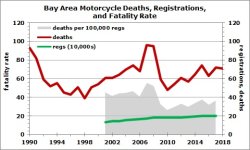
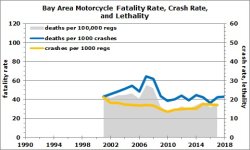
Again my lack of registration data limits conclusions about the Bay Area. Worth noting, however, is that the crash rate, crash lethality, and fatality rate are all quite a bit lower than statewide. I have no explanation for the fact that the 2007-2008 fatality peak was a product of crash lethality rather than crash rate. I have piles of data on those years but haven't dug into it to find an answer. Post-recession, the crash rate mostly paralleled the rest of the state, but lethality remained much lower. One guess about the lower lethality is that many Bay crashes are low-speed freeway and city incidents that usually don't seriously injure the rider.