• There has been a recent cluster of spammers accessing BARFer accounts and posting spam. To safeguard your account, please consider changing your password. It would be even better to take the additional step of enabling 2 Factor Authentication (2FA) on your BARF account. Read more here.

Motostats 2018

Why have motorcycle crashes become deadlier?

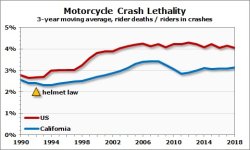
The surprising conclusion from yesterday's post is that motorcycle crashes in the US and in California are more likely to be fatal now than they were 30 years ago. The percentage is low--only 4% of US crashes and 3% of California crashes take the life of the rider--but still, this seems contrary to what we know about the sport. Protective gear, improved and worn much more often than 30 years ago, should be reducing crash lethality.

attachment.php


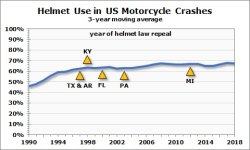
However, since 1997 all-rider helmet laws have been repealed in six states, including four of the top 10 US motorcycle states. Has reduced helmet use increased crash lethality?

attachment.php


Seems not. In spite of the repeals, helmet use has been gradually rising, not falling. Even in states with no helmet requirement, helmet use has increased. In Michigan, the most recent repeal, 70% of crash-involved riders are wearing one. In Texas it's 59%, in Florida 55%.


Older riders are more vulnerable riders

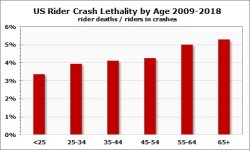
After discovering the lethality increase a few years ago, I wondered if it had resulted from more violent crashes. Maybe brave young riders on 180mph sportbikes had inflated the fatality data. That guess was crushed when I found that young riders, particularly those under age 25, were at less risk of dying in the event of a crash than older riders. Digging deeper, I found that the 55+ age group, not the < 25 group, was pushing lethality higher.

attachment.php


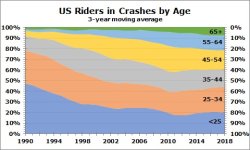
And the 55+ age group has been growing for 30 years:

attachment.php


Since 1990, 26% of motorcyclists involved in crashes in the US have moved statistically from the least vulnerable age group--the under 25s--into more vulnerable groups, most of them into the most vulnerable groups. This accounts for a substantial part of the lethality increase.

In post #9 of this thread, I concluded that growth in the 55+ age group had reduced the crash rate. Increased crash lethality is the downside of that change.


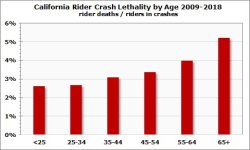
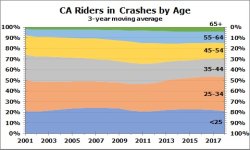
Lethality by age in California is similar to the US:

attachment.php


My detailed California crash data includes rider age back only to 2001, so I can't present an age distribution graph that includes earlier years, but what I have does show that the percentage of crash-involved riders age 55+ doubled from 2001 to 2018:

attachment.php


A more deadly mix of vehicles on the road

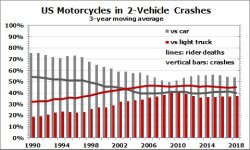
Over the past 30 years, the typical family transportation appliance has morphed from a Taurus or Accord into an F-150, Odyssey, or Suburban. This has not been a welcome development for motorcyclists, because the latter group--classified as light trucks by NHTSA--is much less crash-friendly to us. The late Wendy Moon wrote about the impact of this shift in a 2004 Motorcycle Consumer News article, "Fatal Design", and I have kept track of the relevant crash data subsequently.

attachment.php


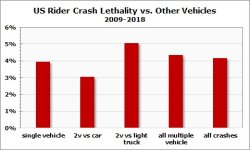
In 1990, light trucks--pickups, vans, minivans, SUVs, crossovers--comprised less than 20% of vehicles involved in 2-vehicle motorcycle crashes, but accounted for 32% of the rider deaths that occurred in those crashes. In that same year, cars accounted for 75% of crashes and 55% of deaths. Since then, light truck involvement has increased to 37% of crashes and 45% of deaths. Clearly, the difference in motorcyclist crash lethality between cars and light trucks is huge:

attachment.php


Conclusion

In spite of improvements in motorcycle protective gear and its growing use, crashing has become more deadly over the past 30 years. The observed increase in motorcycle crash lethality can be explained in substantial part by the aging riding population and the mix of other vehicles on the road. Neither of those factors is likely to change in the foreseeable future.

Motorcyclist median age seems to have stabilized in the late 40s. It has gone from a young man's sport to one that appeals to men and women over a wide age range. While crash risk is lower thanks to the presence of older, more conservative riders, vulnerability to fatal injury has increased due to the same change in age distribution.

For a variety of reasons, Americans enjoy big vehicles to transport themselves and their families. Fifty years ago it was a Buick Electra Deuce-and-a-Quarter. Today, it's a Ford F-350 or Mercedes GLS or whatever, which poses serious danger to a motorcyclist in the event of a crash. The increase in light trucks from < 20% of multiple-vehicle motorcycle crashes 30 years ago to 37% today has resulted in an additional 280 rider deaths per year by my estimate. In no feasible scenario will these vehicles soon become either less popular or less deadly.
 

Attachments

  • lethality helmet use.jpg
    lethality helmet use.jpg
    44.6 KB · Views: 760
  • lethality age.jpg
    lethality age.jpg
    36.8 KB · Views: 295
  • lethality age dist.jpg
    lethality age dist.jpg
    50.5 KB · Views: 297
  • lethality by age CA.jpg
    lethality by age CA.jpg
    34.8 KB · Views: 299
  • lethality overall.jpg
    lethality overall.jpg
    41.9 KB · Views: 282
  • lethality lt involvement.jpg
    lethality lt involvement.jpg
    67.2 KB · Views: 292
  • lethality comparison.jpg
    lethality comparison.jpg
    36.4 KB · Views: 293
  • lethality age dist CA.jpg
    lethality age dist CA.jpg
    49.8 KB · Views: 288
Last edited:
tl;dr

Here's a summary of my main posts in this thread. Links are to those posts.


That's it for me. I have no more posts planned for this thread, but I will be glad to answer any questions you have, so post them up.

I haven't cited sources, but everything that appears is from a federal or California government publication. If you have a question on the data, send me a PM and I'll reply with a link or document.
 
Last edited:
Thanks for the education!

I like learning the data.

Not all great news but facts are important, whether good or bad.
 
Thanks for the summary Dan.

Makes it easier to catch up again later.
 
For a variety of reasons, Americans enjoy big vehicles to transport themselves and their families. Fifty years ago it was a Buick Electra Deuce-and-a-Quarter. Today, it's a Ford F-350 or Mercedes GLS or whatever, which poses serious danger to a motorcyclist in the event of a crash. The increase in light trucks from < 20% of multiple-vehicle motorcycle crashes 30 years ago to 37% today has resulted in an additional 280 rider deaths per year by my estimate. In no feasible scenario will these vehicles soon become either less popular or less deadly.

Good stuff Dan.

My Dad had an Electra 225 he bought in 1966, the year I came to this Country from the UK.

I read an article in an actual moto rag many moons ago how much more dangerous to a rider hitting the side of an SUV was compared to hitting the side of a car.

Maybe it was MCN?
 
Good stuff Dan.

My Dad had an Electra 225 he bought in 1966, the year I came to this Country from the UK.

I read an article in an actual moto rag many moons ago how much more dangerous to a rider hitting the side of an SUV was compared to hitting the side of a car.

Maybe it was MCN?
Probably so. MCN ran "Fatal Design" by Wendy Moon in the July 2004 issue.

It didn't get as much attention as expected. ISTR that editor Fred Rau had promoted it on the MCN forum as a big deal. However, she implausibly exaggerated the number of motorcyclist deaths due to the shift to light trucks, and there were some errors and ambiguities in the graphics presented with the article. I was highly skeptical at the time.

However, I did start keeping track of 2-vehicle motorcycle crashes and eventually (years later) came to agree that the effect is real, though estimating a much more modest magnitude.
 
Mean time between motorcyclist death?

Dan,

When I see statistics like this is makes me wonder, can you extrapolate the yearly rate of fatalities into creating an estimate: people who ride X years will have Y risk of dying in a motorcycle accident?

Of course YMMV, but I'm just thinking of all the people who think motorcycling is a death sentence and superficial math from these charts seems to indicate that the vast majority of long-term riders will not die on a motorcycle (or am I reading this wrong?)
 
When I see statistics like this is makes me wonder, can you extrapolate the yearly rate of fatalities into creating an estimate: people who ride X years will have Y risk of dying in a motorcycle accident?
IOW, average risk of death over X years? With various assumptions, that's a fairly easy estimate to make. From 2014 to 2018, Americans exposed themselves to 43 million motorcycle-years of danger. A "motorcycle-year" is one motorcycle registered--and presumably ridden--for one year. Over that same period, 24,000 riders were killed. So roughly 1 in 1800 riders died per year of exposure. Since 1990, that average rate has ranged from 1 in 1400 (lower number, higher risk than today) to a high near the current value. As a wild-ass guess, with all the unstated underlying assumptions, on average, someone who rides for 10 years will have a 0.55% chance of dying on a motorcycle in that time.

Of course YMMV, but I'm just thinking of all the people who think motorcycling is a death sentence and superficial math from these charts seems to indicate that the vast majority of long-term riders will not die on a motorcycle (or am I reading this wrong?)
You're reading it the same way I read it: Risk of death on a motorcycle is lower than most people think it is. It's not low by the standards of the safety-obsessed who pore over Consumer Reports car crashworthiness ratings, but it is within the range of other normal modern activities. It's about the same, per hour, as general aviation, for example.
 
IOW, average risk of death over X years? With various assumptions

Wouldn’t deaths per moto mile be a bit more informative? I could see plotting in three dimensions a graph showing fatalities as a function of years of experience and annual miles ridden. Hypothesis is that risk of dying declines with years of experience at some rate; but shows a different relationship with annual mileage.

Dunno. Interesting stuff.
 
Wouldn’t deaths per moto mile be a bit more informative? I could see plotting in three dimensions a graph showing fatalities as a function of years of experience and annual miles ridden. Hypothesis is that risk of dying declines with years of experience at some rate; but shows a different relationship with annual mileage.
In the context of Manzanita's question, the rate per registration-year seems most enlightening and straightforward. It was about the public perception of risk to the average motorcyclist.

You dig a little deeper with the point about the effect of experience--an equally interesting question. Hurt and MAIDS both support your hypothesis that it reduces crash risk. IOW, it's a good thing. (Estimating fatality risk by experience would require far more data than could be gathered in a one-year study of 900 crashes.)

attachment.php


Your proposed third dimension--annual miles--makes it a much harder question. Most motorcyclists understand that experience reduces per-mile risk. And we would also agree that more miles per year increases annual risk. But how do those two factors combine? Who knows?

My feeling is that while experience decreases per-mile risk, the reduction isn't as much as we might expect. In the MAIDS data, the 8+ years group had one-third the risk of the half-year group. Good, sure, but it's not one-tenth, as I probably would have guessed before seeing the data.

With experience we develop partial immunity to the common crashes--left-turners, cutoffs, rear-enders, etc. By living through the close calls (and maybe a few actual crashes) we learn how to avoid them. But experience doesn't protect us from rare, shit-happens events. When I get a little too proud of myself for avoiding crashes, I think about a 2011 crash in San Diego County that took the life of a respected Streetmasters instructor. In the rain on I-805, the driver of a Lexus SUV lost control and spun into a big rig in the right lane, then caromed back toward the center divider, taking out a BMW R1100S.

The more we ride, the more we expose ourselves to unpredictable, unavoidable risks.
.
 

Attachments

  • experiencegraf.jpg
    experiencegraf.jpg
    60.2 KB · Views: 140
Last edited:
How do we crash?

This post is about a year late and includes data from 2019, but I thought it would be a worthwhile addition to the thread. It is the latest result from an ongoing project of mine to classify motorcycle crashes, based on US DOT data, in ways helpful to motorcyclists (a project that has yielded more failure than success).

From US DOT's Crash Report Sampling System (a weighted sample of US motor vehicle crashes) and Fatality Analysis Reporting System (a detailed accounting of all fatal motor vehicle crashes), I have defined a set of motorcycle crash configurations and, for each crash type, counted the number of motorcycles involved and rider fatalities. For better results I have combined 10 years of data representing more than one million crashes.

The three graphs that follow show occurrences by crash type, rider deaths, and crash lethality--the number of riders killed divided by the number of riders in crashes. Following that are crash type descriptions, and, finally, I've included a table of data from which the graphs were produced.


Crashes by type

Count of motorcycles involved in crashes by crash type. The "other" types grouped together include head-on, merging vehicle, U-turn, and backing, as well as those for which the source data was insufficient to determine crash type.

Road departure and overturns combine to 35% of all crashes. These are single-vehicle, and most (but not all) reflect inadequate skill in controlling the motorcycle. Most of the rest are multiple-vehicle resulting from traffic conflicts.

attachment.php


Deaths by type

This is a count of motorcycle riders (not passengers) killed in crashes by crash type. The "other" types grouped together include sideswipe same direction, merging vehicle, U-turn, and backing, as well as those for which the source data was insufficient to determine crash type.

Road departure is again at the top of the list. Left turns cause by far the greatest number of multiple-vehicle crash deaths, as expected.

attachment.php


Lethality by type

Percentage of crashes of each type in which the rider was killed. Head-ons are by far the deadliest, but fortunately add up to a relatively small number of deaths. Road departures and left turns, on the other hand, are both frequent and frequently deadly.

attachment.php


Crash types

  • Backing: Striking and struck are differentiated in the source data, but motorcycle is almost always struck. Infrequent, low lethality.

  • Crossing vehicle: Collision with vehicle either on intersecting straight path or turning across the motorcycle's path (except left turns, counted separately). Includes red-light runners, both the motorcyclist and the other driver. Average lethality.

  • Departed road: Motorcycle ran off road. Virtually all single-vehicle, most often when turning, many while going straight, a few "other", usually when changing lanes or passing. Can be with loss of traction, to avoid a hazard in the road, or just riding off the road. Twice as likely to happen on the right as on the left. This is the most common kind of crash in this analysis and is also high lethality due to impact after leaving the road-- curb, guardrail, ditch, wall, tree, etc.

  • Head-on: Includes both direct head-on and sideswipe vs. vehicle traveling in the opposite direction. Not a frequent kind of crash but very high lethality.

  • Left-turn: Includes collisions both with oncoming left-turner and vehicle turning left from the rider's right. The former scenario occurs twice as often as the latter. High lethality.

  • Merging vehicle: Right-turner from right, left-turner from left, merging from adjacent lane, entering traffic--either by motorcycle or other vehicle. Low lethality.

  • Obstacle in road: In addition to fallen trees, ladders, tire treads, etc., includes pedestrians and animals as well. Less lethal (to the motorcyclist) than average.

  • Overturn: Presumably due to loss of grip, but available data doesn't tell the story in enough detail. Half while going straight, the other half split between turning and other (includes changing lanes, passing, and decelerating). A very frequent type of crash but low lethality.

  • Rear-end: Differentiated between striking vehicle ahead, being struck from behind, and "other", which includes sandwich rear-enders. Overall, a frequent type of crash but less lethal than average. Striking the vehicle ahead is more frequent and more lethal than getting hit from behind.

  • Sideswipe same direction: Sideswipe in which both vehicles are traveling in the same direction. There's probably some ambiguity between this type and merging vehicle crashes. Sideswipe is reported more frequently and is equally low in lethality.

  • U-turn: Not differentiated between U-turn from right shoulder and from oncoming lane. High lethality.

  • Other/unknown: In 8% of crashes, no crash type was reported and I wasn't able to infer events from other variables. These are divided approximately evenly between single- and multiple-vehicle. Lethality somewhat less than average.

Crash count detail

Here's a summary of crash type data from which the graphs were produced. Major categories are in bold. Where I have broken a category into subcategories, the subordinates are below the bold.

crash type | count | % | rider deaths | % | lethality
---------------------------------------|--------------------|----------|--------------------|----------|-----------
backing | 10,784 | 1% | 85 | 0% | 0.8% crossing vehicle | 102,001 | 9% | 4,180 | 9% | 4.1% departed road | 193,842 | 18% | 14,926 | 32% | 7.7%
---going straight|72,091|7%|4,502|10%|6.2%
---turning|106,403|10%|9,193|20%|8.6%
---other|15,348|1%|1,231|3%|8.0%
head-on | 24,810 | 2% | 3,344 | 7% | 13.5%
---head-on|14,655|1%|2,463|5%|16.8%
---sideswipe opposite direction|10,155|1%|881|2%|8.7%
left turn | 141,855 | 13% | 9,654 | 21% | 6.8% merging vehicle | 23,556 | 2% | 489 | 1% | 2.1% obstacle in road | 76,041 | 7% | 1,772 | 4% | 2.3% other/unknown | 84,391 | 8% | 2,860 | 6% | 3.4%
---single vehicle|38,233|3%|1,127|2%|2.9%
---multiple vehicle|46,158|4%|1,733|4%|3.8%
overturn | 185,931 | 17% | 2,724 | 6% | 1.5%
---going straight|96,523|9%|973|2%|1.0%
---turning|52,871|5%|676|1%|1.3%
---other|36,537|3%|1,075|2%|2.9%
rear end | 165,073 | 15% | 4,210 | 9% | 2.6%
---hit vehicle ahead|87,822|8%|2,591|6%|3.0%
---hit from behind|66,778|6%|1,266|3%|1.9%
---other|10,473|1%|353|1%|3.4%
sideswipe same direction | 78,181 | 7% | 1,317 | 3% | 1.7% U-turn | 10,917 | 1% | 511 | 1% | 4.7%
|||||
all single vehicle | 478,470 | 44% | 19,195 | 42% | 4.0% all multiple vehicle | 618,911 | 56% | 26,877 | 58% | 4.3%
|||||
total | 1,097,381 | | 46,072 | | 4.2%
.
.
.
 

Attachments

  • BARF crash type post fig 1.jpg
    BARF crash type post fig 1.jpg
    35.7 KB · Views: 113
  • BARF crash type post fig 2.jpg
    BARF crash type post fig 2.jpg
    32.7 KB · Views: 121
  • BARF crash type post fig 3.jpg
    BARF crash type post fig 3.jpg
    30.9 KB · Views: 114
Last edited:
Thank you for taking the time to share these insights! Your work and contributions cannot be appreciated enough.
 
Back
Top